- self-initiated / 2017
OddityViz
A visual deconstruction of David Bowie’s track Space Oddity on a series of 10 specially engraved records with accompanying posters, and a moving image piece.
Explore Project- self-initiated / 2018
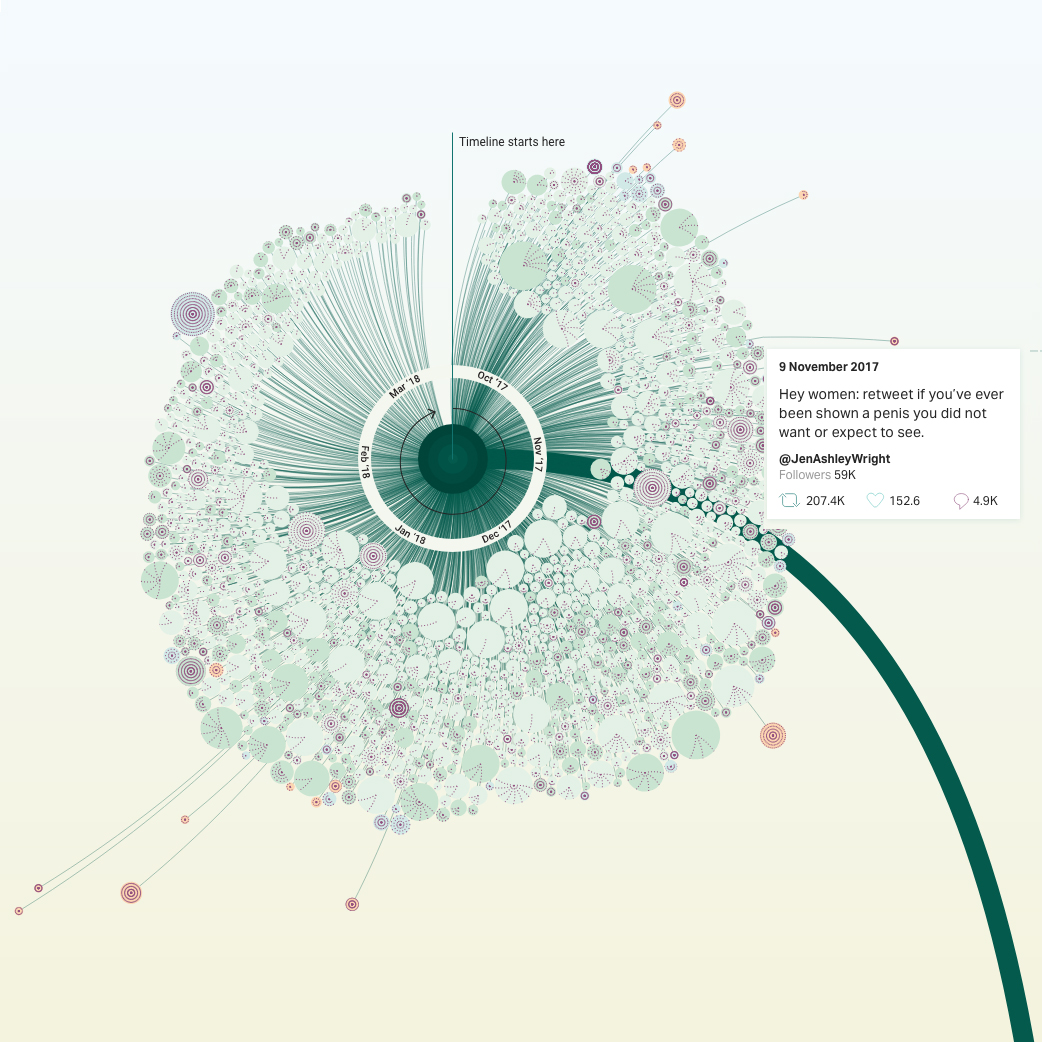
MeToomentum
A self-initiated data visualization project exploring themes, geographical footprint, and key moments of the hashtag MeToo – dissected through the metaphor of the dandelion.
Explore Project- Digital experience / 2018

Reimagine the Game
‘Reimagine the game’ by Siemens is a unique platform that allows football fans to view FC Bayern games by listening to thousands of data points captured within key moments during the match.
Explore Project- Book / 2018
The Brain: a user's guide
A wide range of illustrations, infographics, and visual illusions bring to life fascinating science, surprising stats, and DIY experiments about our brain.
Explore Project- self-initiated / 2014
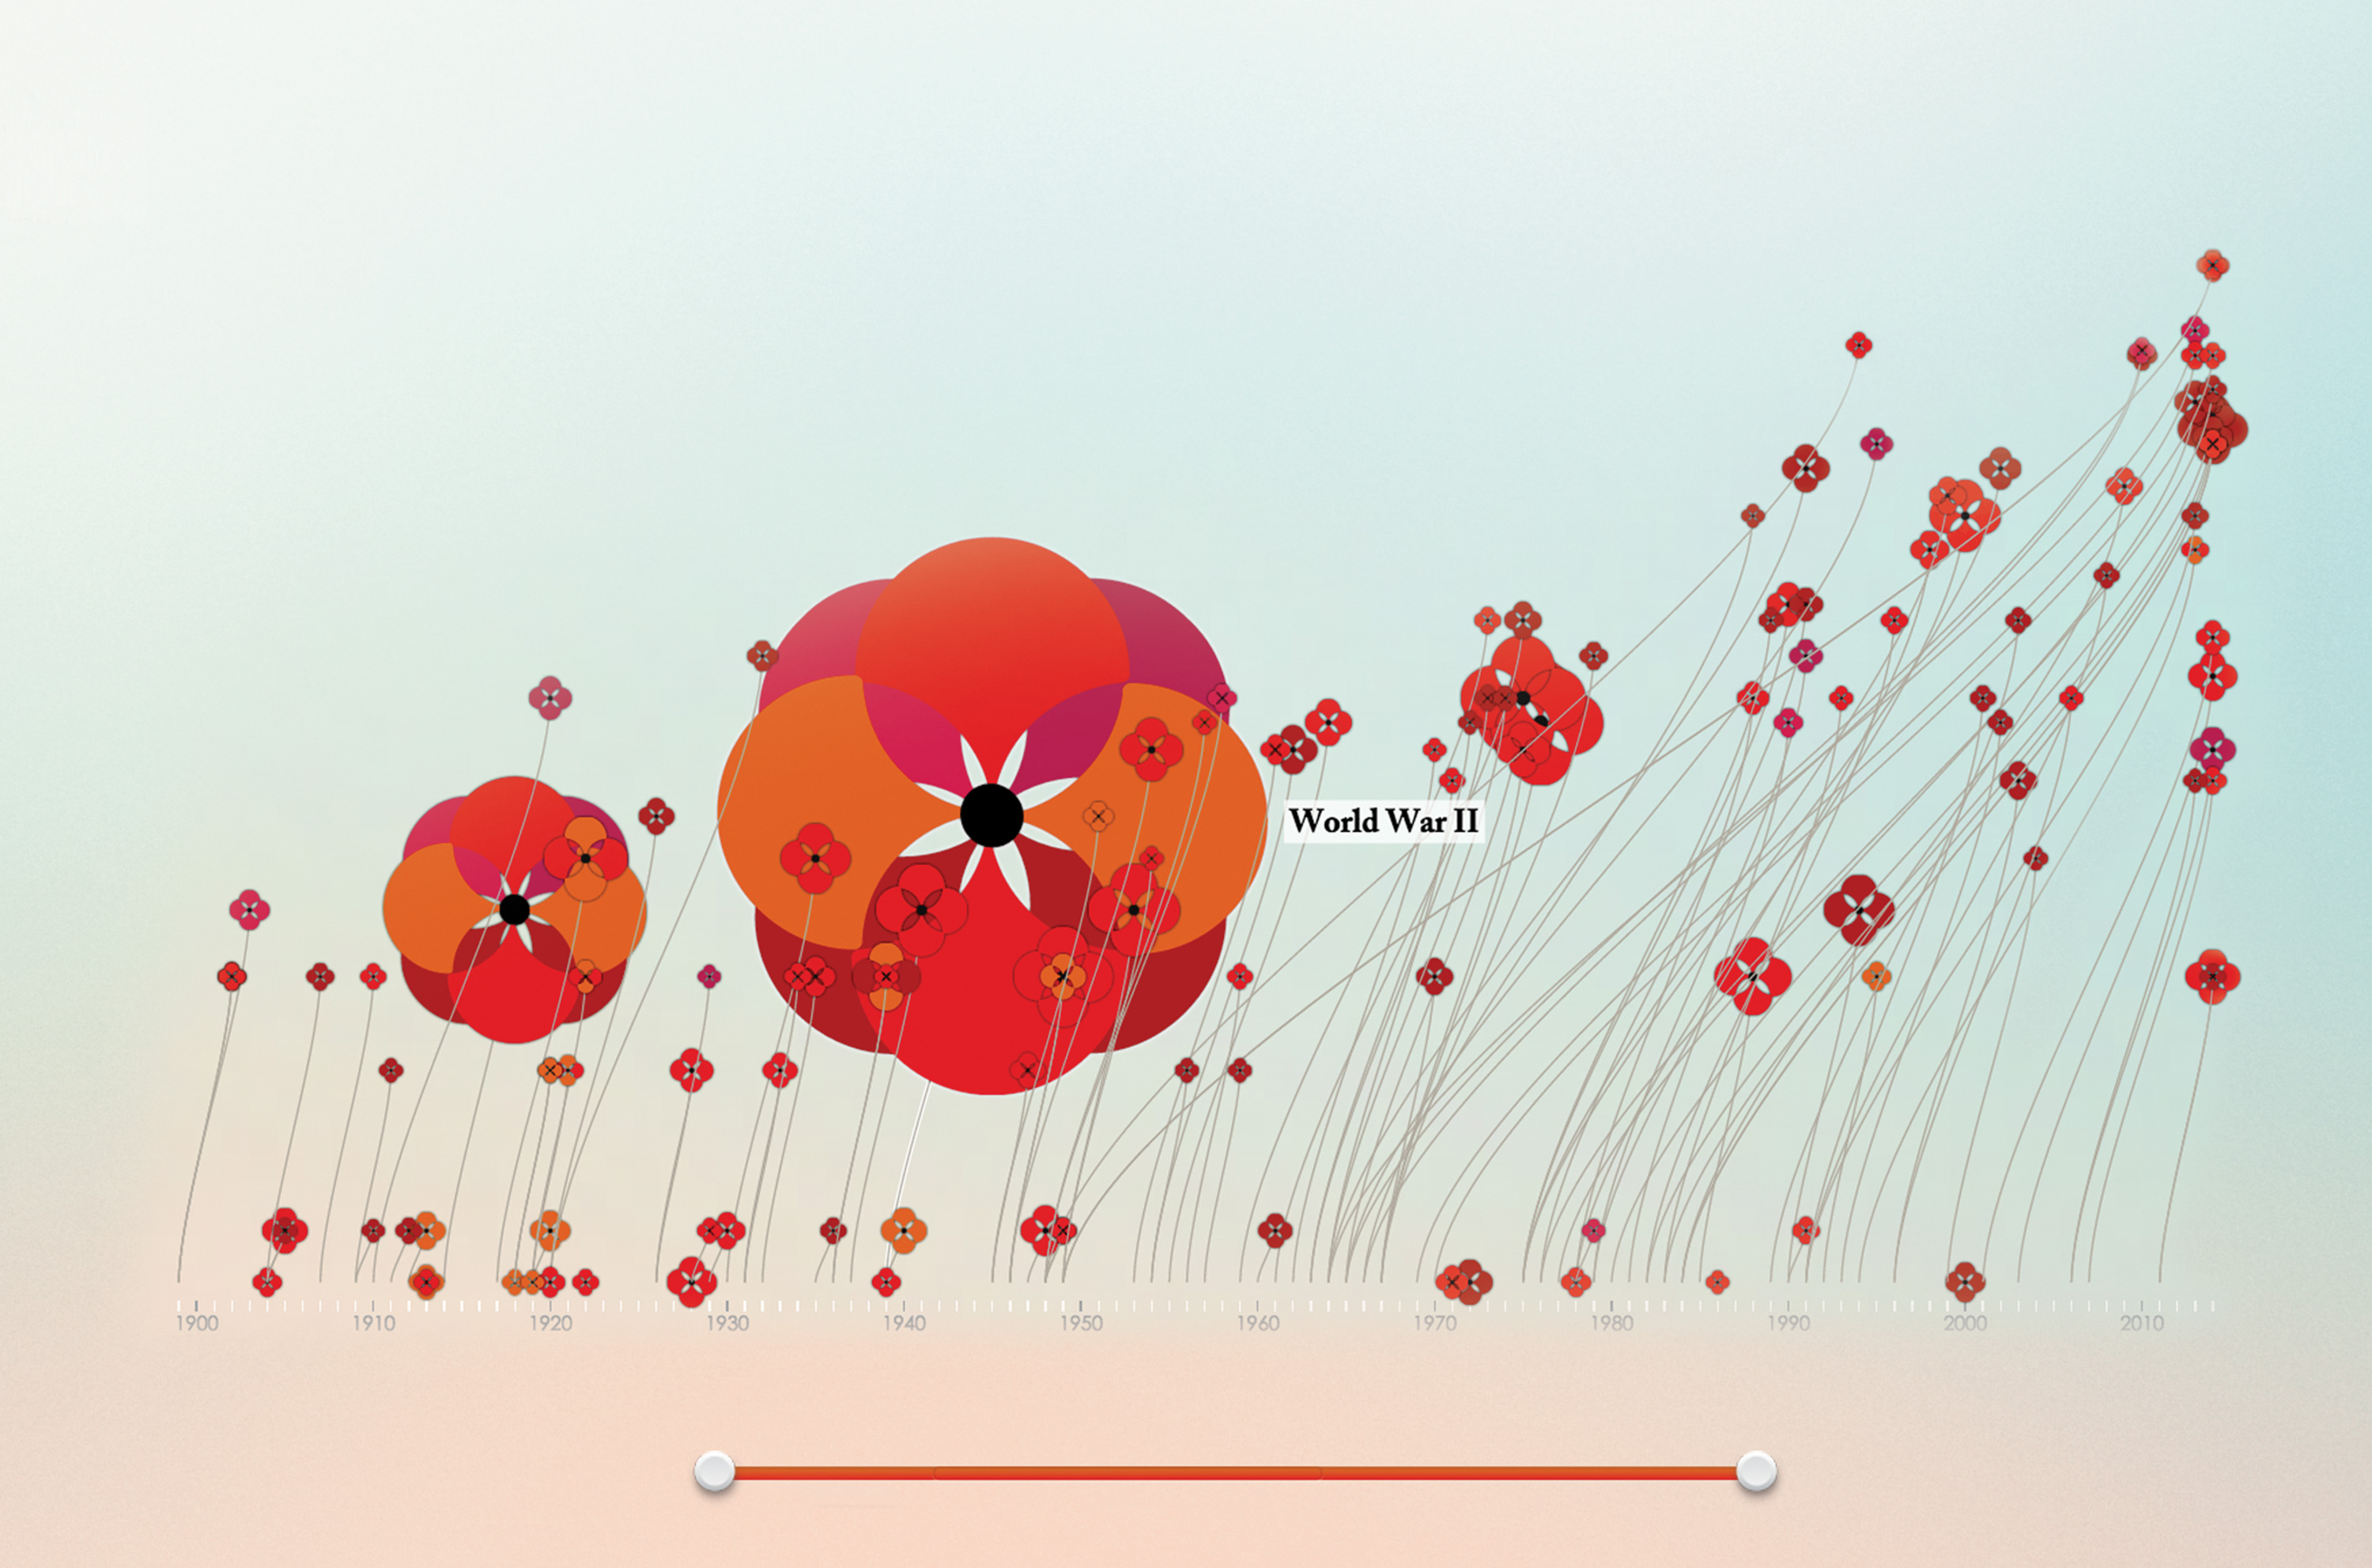
Poppy Field
A reflection on human life lost in war, to observe Remembrance Day and commemorate The Great War’s centenary, Poppy Field visualises the timing, involvement, and death totals for individual wars since 1900.
Explore Project- Book / 2013
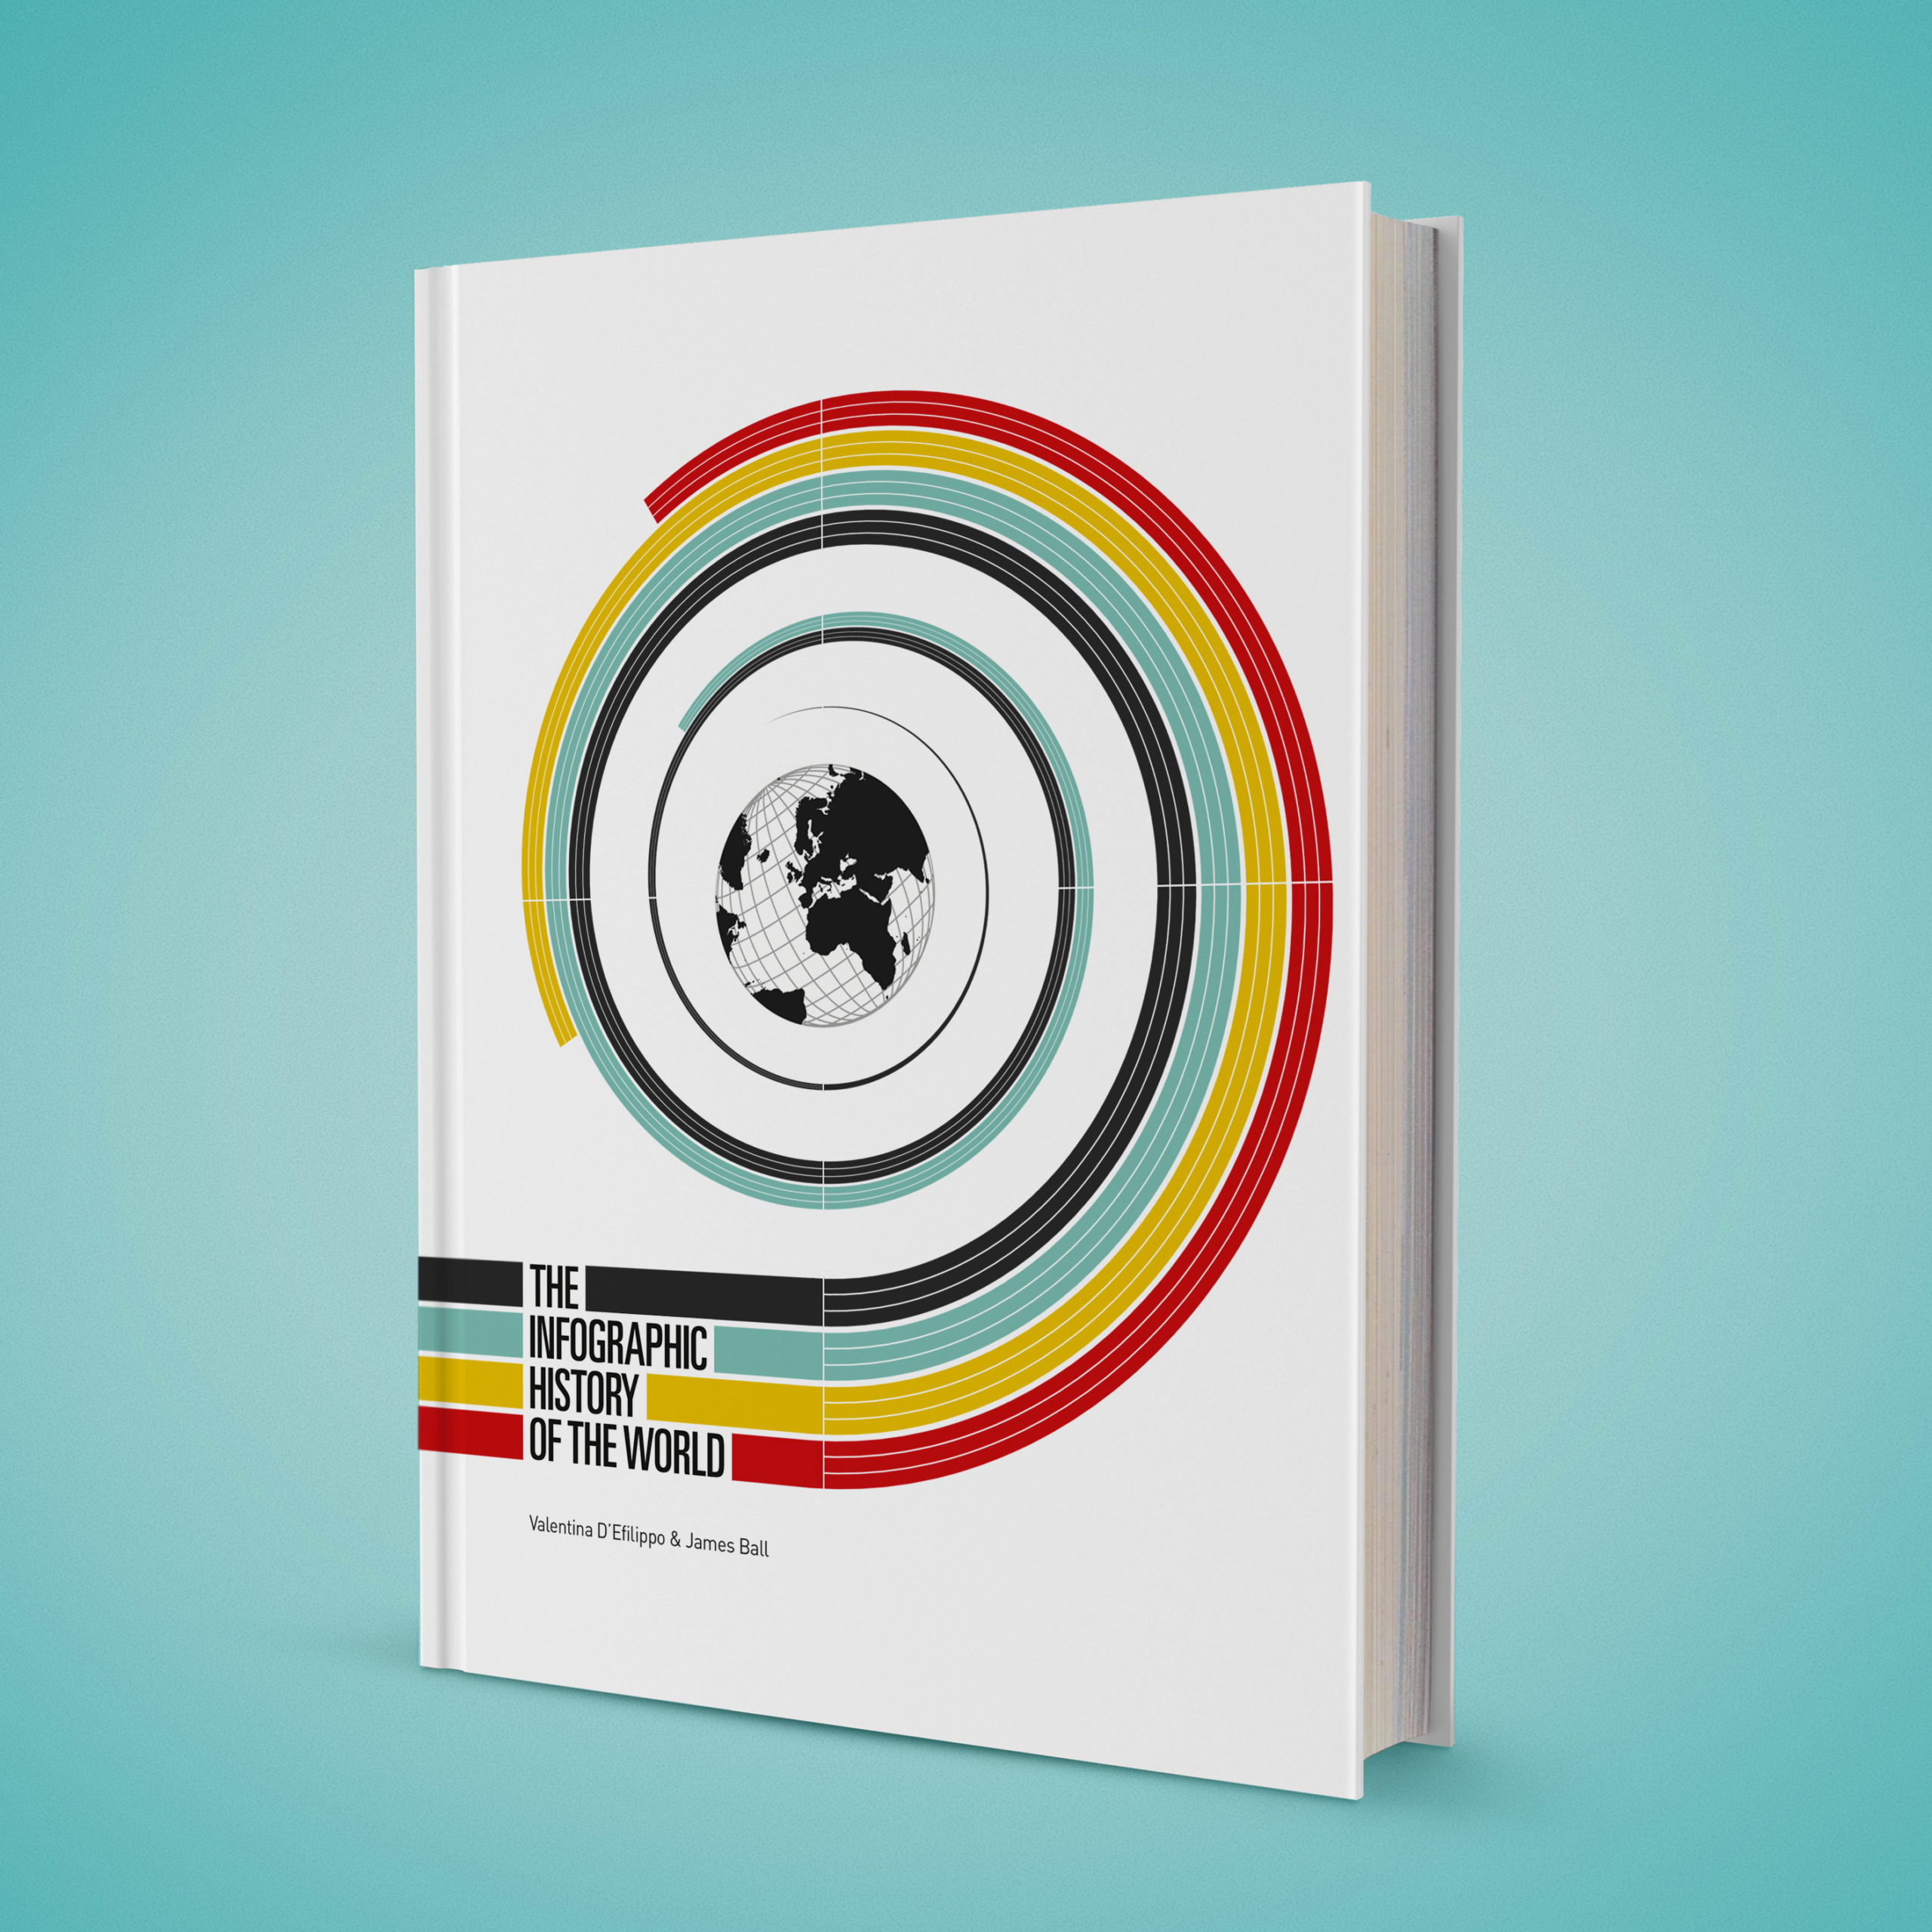
The Infographic History of the World
100 original infographics narrate the evolution of mankind and planet Earth across 13.8 bn years – from prehistory to the modern world.
Explore Project- Physical experience / 2019
Destination Denim
This interactive fitting room, displayed at Amazon’s first physical fashion festival, Destination Denim Berlin, allows visitors to find their perfect style, navigating 2000 pairs of jeans using voice.
Explore Project- Digital experience / 2019
Atlas of Digitalization
The Siemens Atlas of Digitalization is a web-based application that reveals the readiness and potential of six major cities through data visualization.
Explore Project
- Live performance / 2014
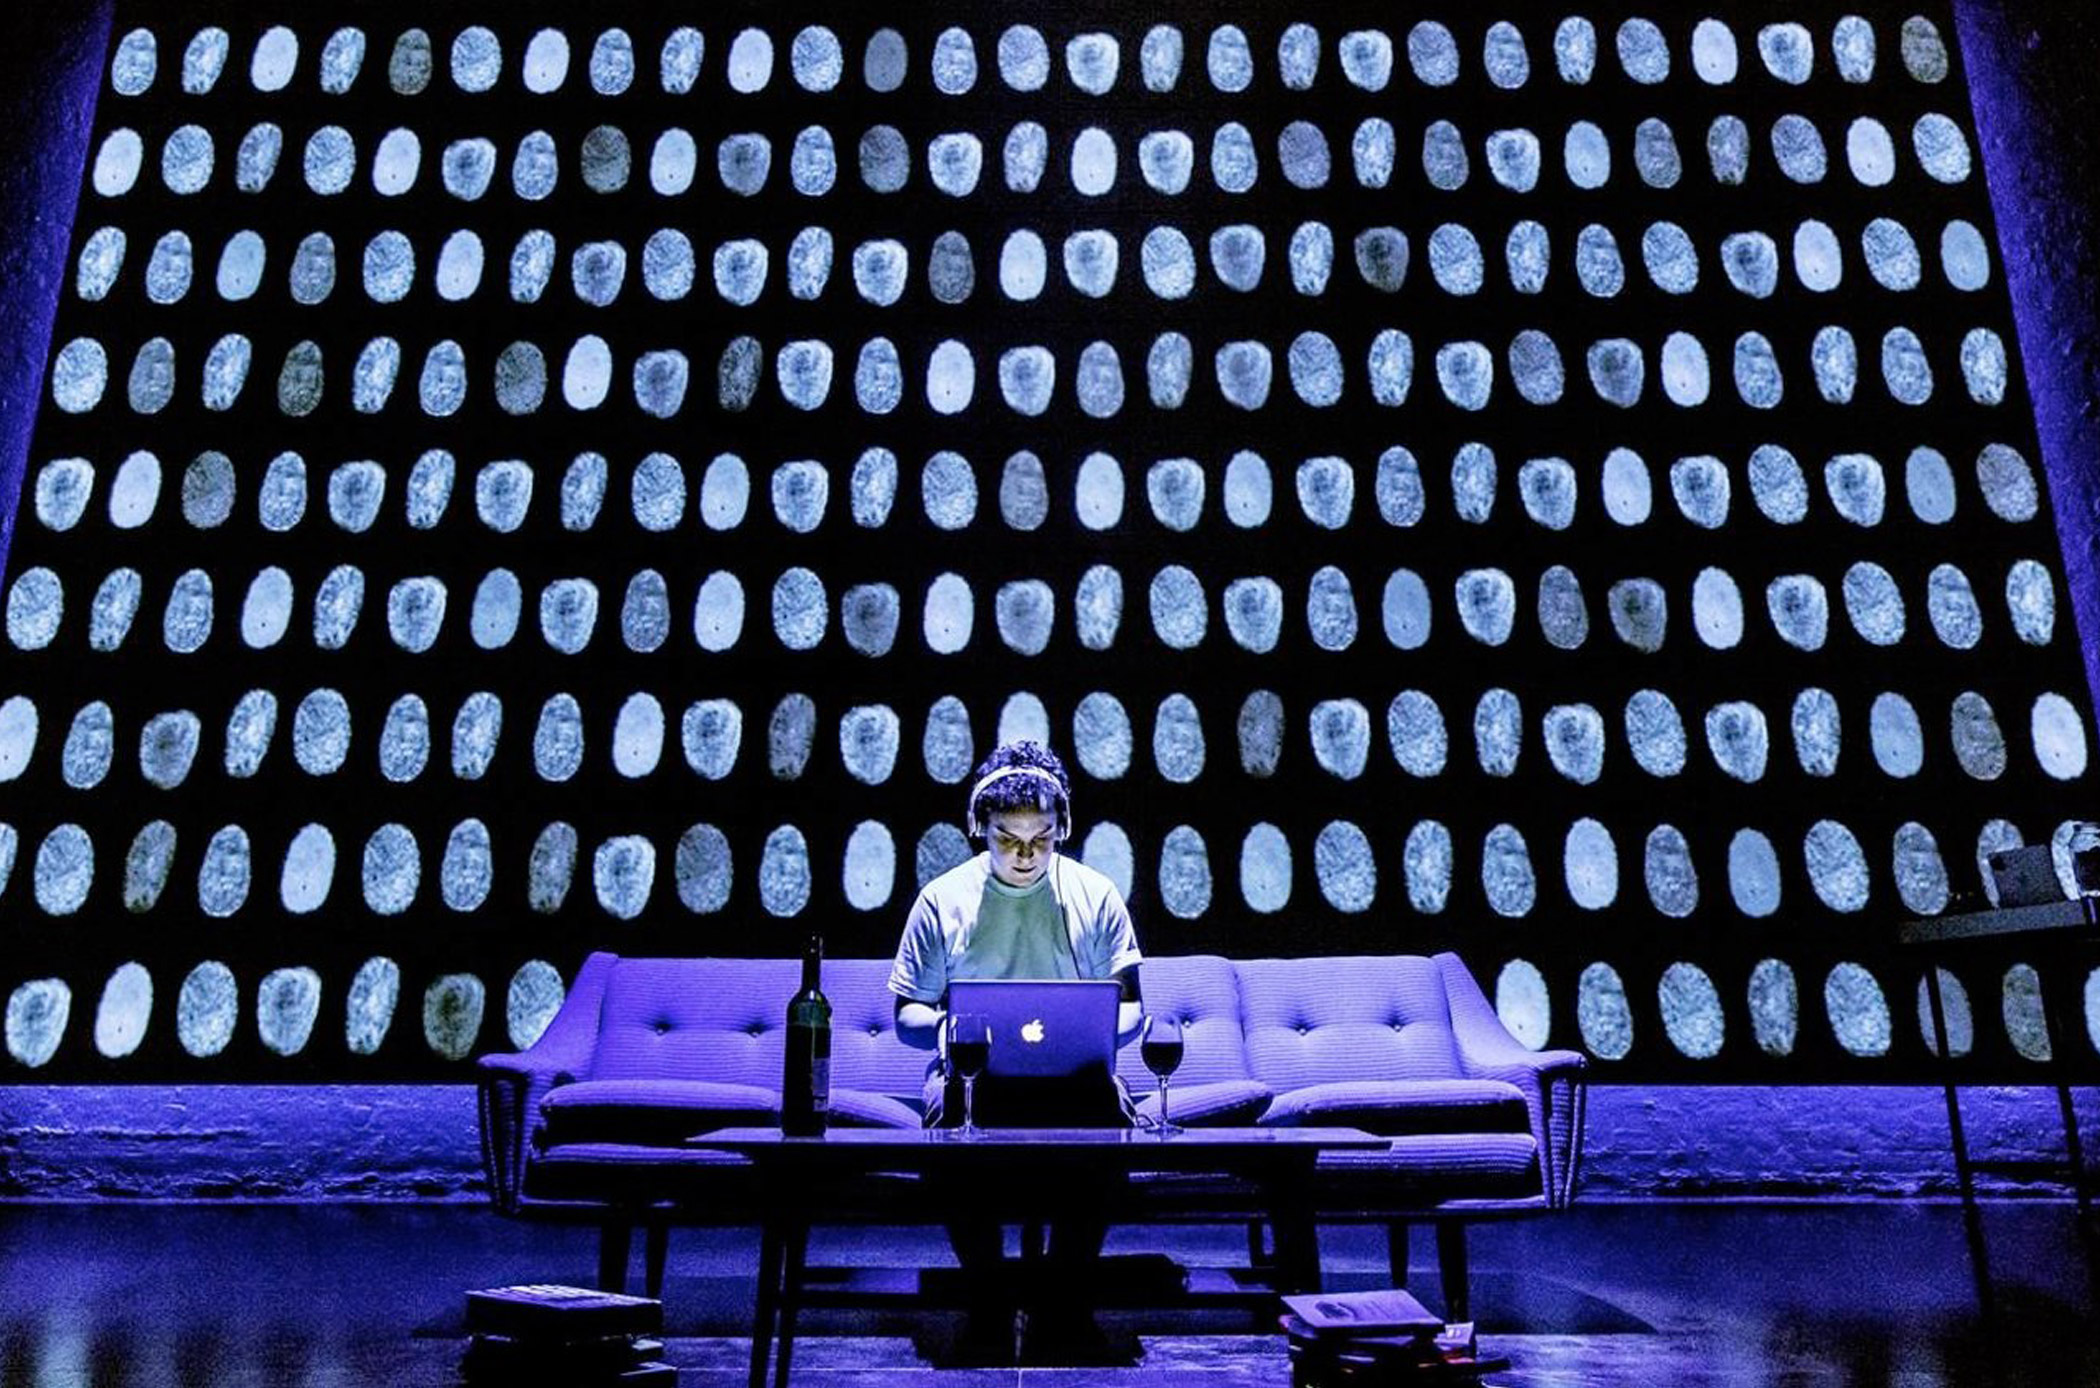
Privacy
Large data visualization projections during the West End play, Privacy, which set out to outline the implications of our online interactions.
Explore Project- Live performance / 2019

Here the Blind Spot
Data4Change helped Together! an Ethiopian disability organisation, to advocate for people with visual impairments through data sonification and storytelling.
Explore Project- Brand identity / 2019
McKinsey's New Identity
As part of the global McKinsey’s new identity, these guiding principles elevate the presentation of insights through data visualizations and infographics.
Explore Project